Overview
Company: Gray Matter Analytics
Role: Lead UX Designer
Timeframe: September 2022 - Present
Tools: Figma, Jira, Confluence, SurveyMonkey
Context & Problem Statement
Gray Matter Analytics provides healthcare organizations with advanced analytics tools, specifically focusing on Performance Insights, Contract Insights, and Population Insights. These categories enable healthcare providers to manage clinical performance, optimize payer contracts, and monitor population health trends. However, users often found the interface complex, leading to inefficient use of the platform’s capabilities. The abundance of data made it hard for users to locate the information they needed, especially when it came to these three core areas.
Problem: Users, including clinical managers and contract administrators, reported that the complexity of the existing platform prevented them from efficiently interpreting insights across performance, contract, and population data. This inefficiency hindered timely decision-making and reduced the overall value of the platform.
Objective
The goal was to redesign Gray Matter Analytics’ platform to make the Performance, Contract, and Population Insights more intuitive and actionable for users. Specific objectives included.
Simplifying the workflow to access insights for clinical performance, contract optimization, and population health.
Improving data visualization to highlight critical insights without overwhelming users.
Creating a seamless experience that allows users to customize views based on their role (e.g., clinical, financial, or administrative).
User Research & Insights
User Personas
Clinical Managers (Primary Persona):
Needs: Quick access to clinical performance data to track patient outcomes and optimize care.
Pain Points: Struggling to locate performance data and trends in a usable format.
Population Health Analysts:
Needs: A system that tracks and analyzes health outcomes for large populations.
Pain Points: The complexity of filtering population health data to uncover patterns and make proactive decisions.
Contract Administrators (Secondary Persona):
Needs: Tools to evaluate and optimize payer contracts.
Pain Points: Difficulty extracting contract-specific insights to manage value-based care agreements.
Research Methods
Interviews & Surveys:
Conducted interviews with 10 key users from healthcare providers to understand how they use performance, contract, and population insights in their daily workflows.
Data Analytics:
Analyzed platform usage data to identify areas where users struggled with accessing insights efficiently.
User Testing:
Ran usability testing sessions with prototypes to observe how users interact with the insights categories, gathering feedback on pain points.
Key Findings
Performance Insights: Users reported challenges in comparing performance metrics, leading to delays in addressing clinical inefficiencies.
Population Insights: Population health analysts struggled to find actionable insights among vast datasets, leading to missed opportunities for proactive health interventions.
Contract Insights: Contract administrators found it difficult to track payer contract performance and optimize agreements due to the platform’s convoluted design.
Design Process
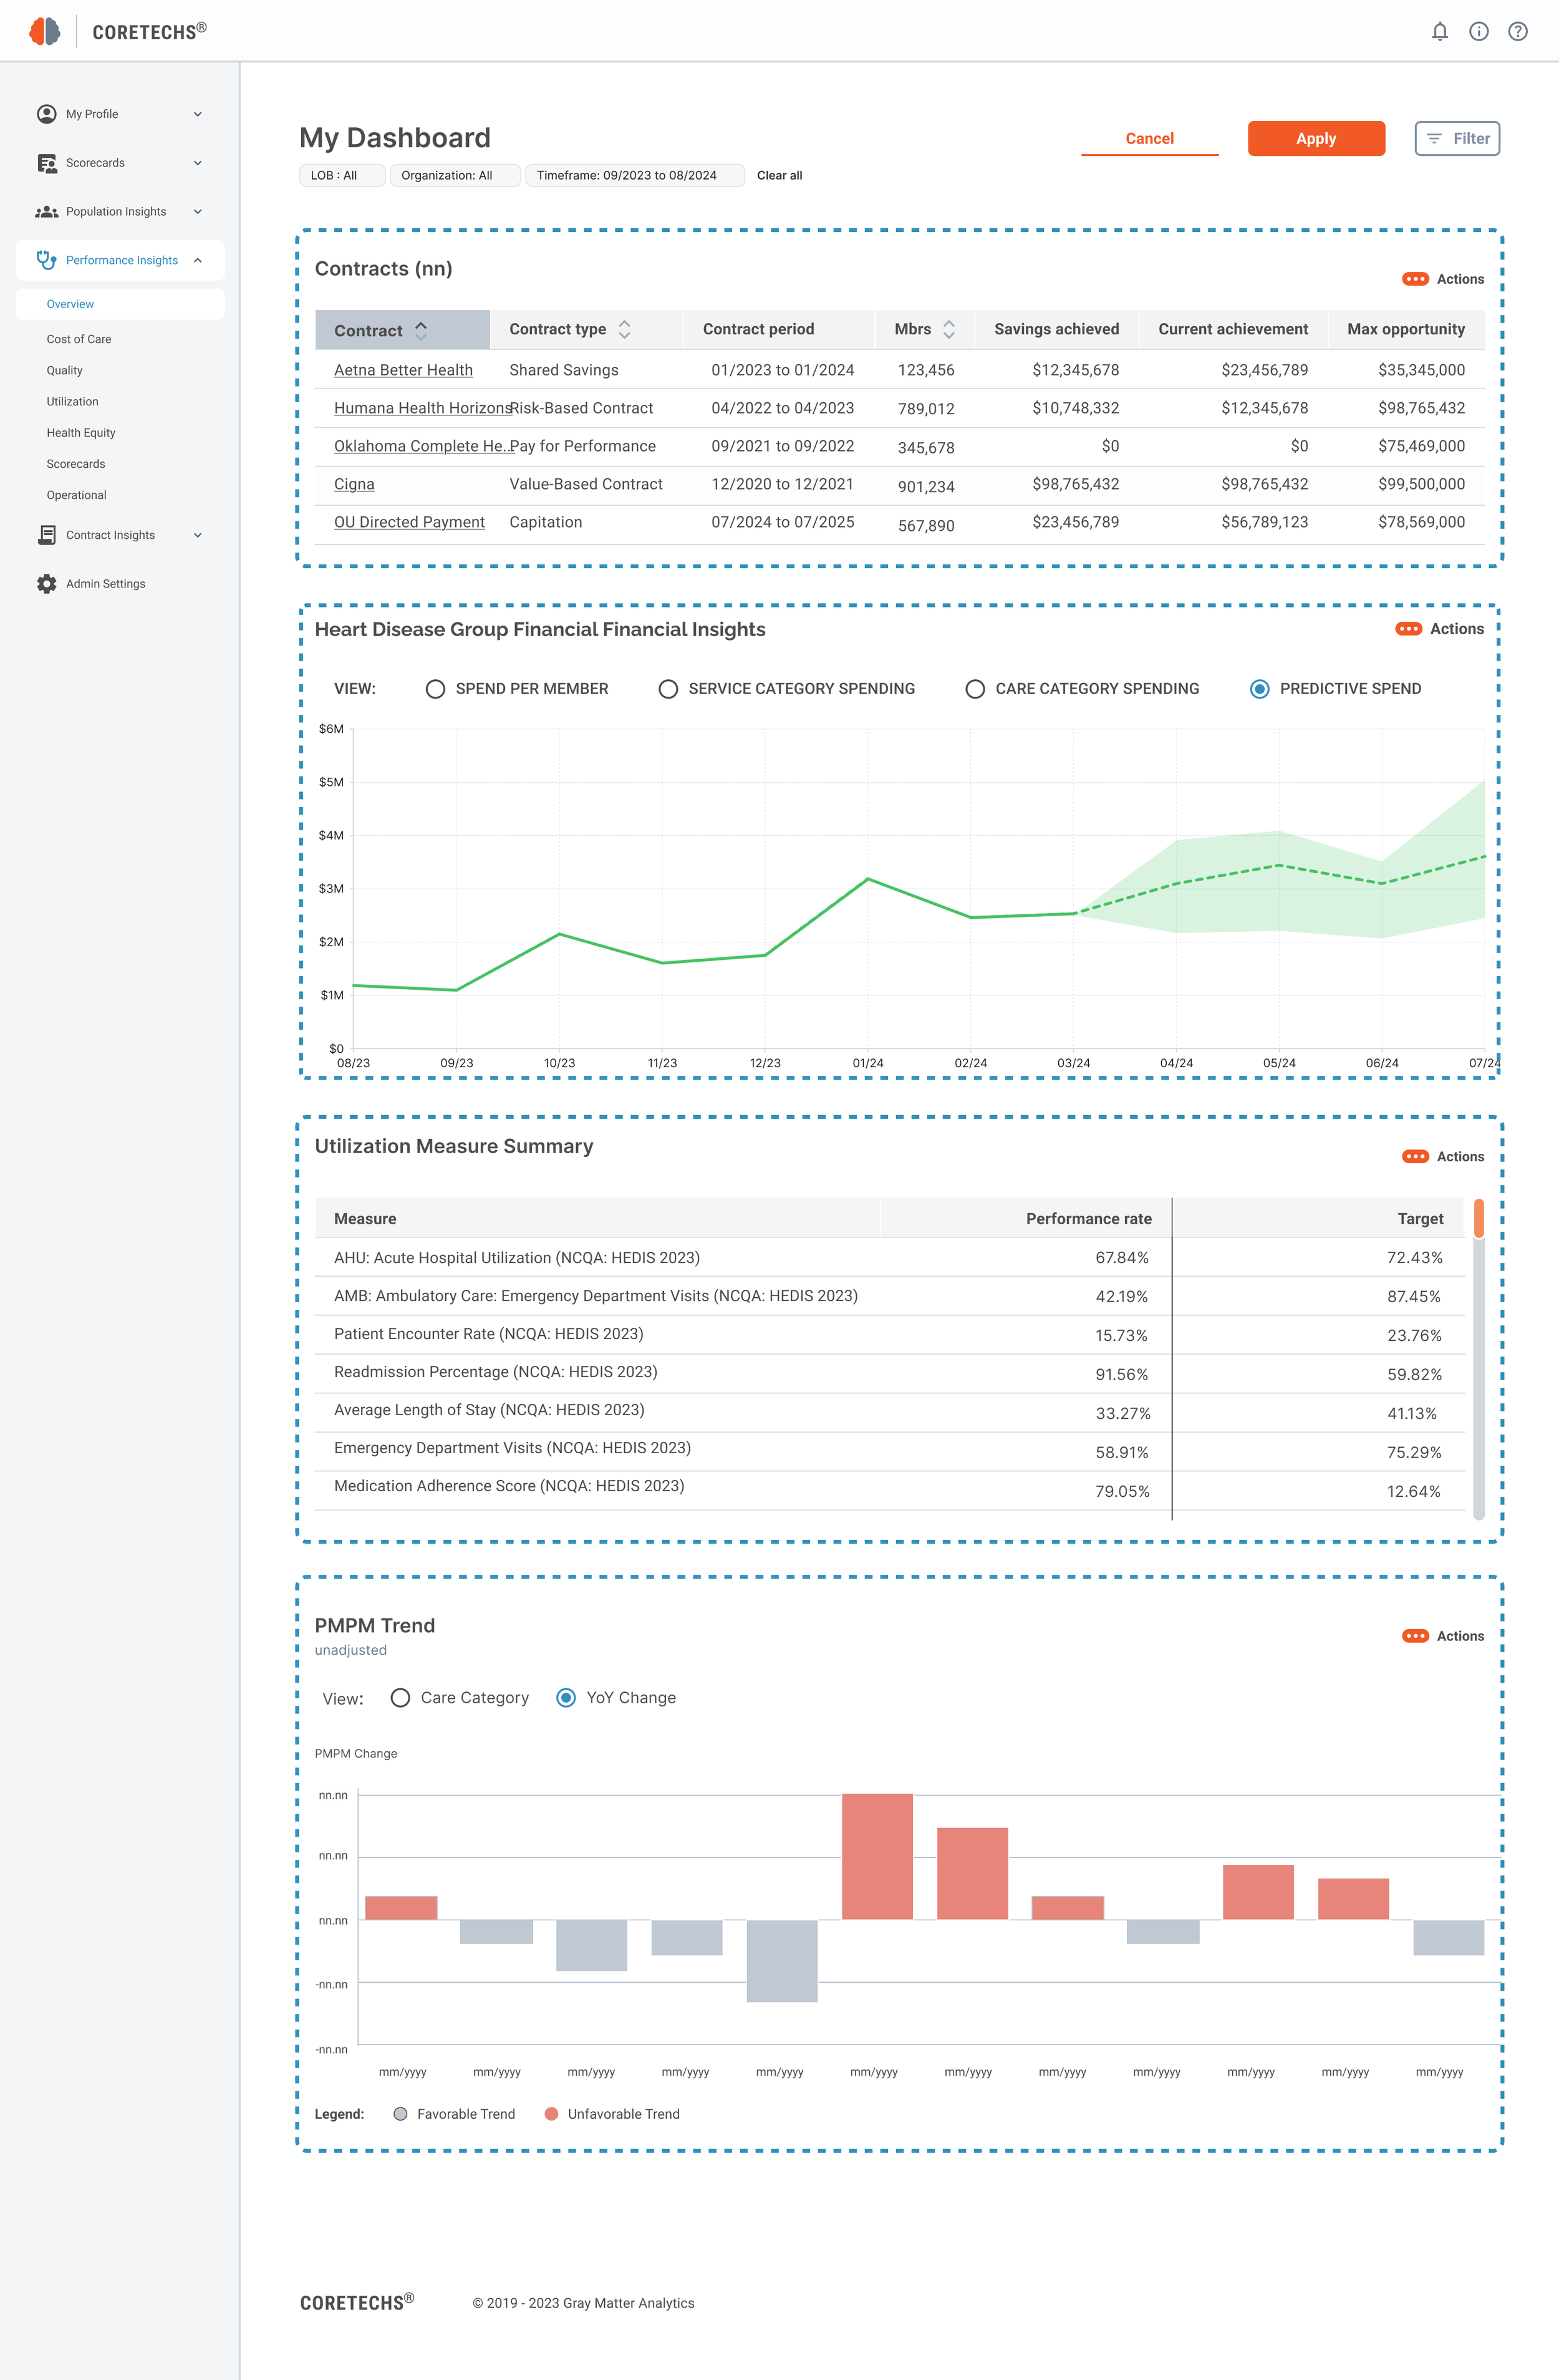
1. Redesigning Performance Insights
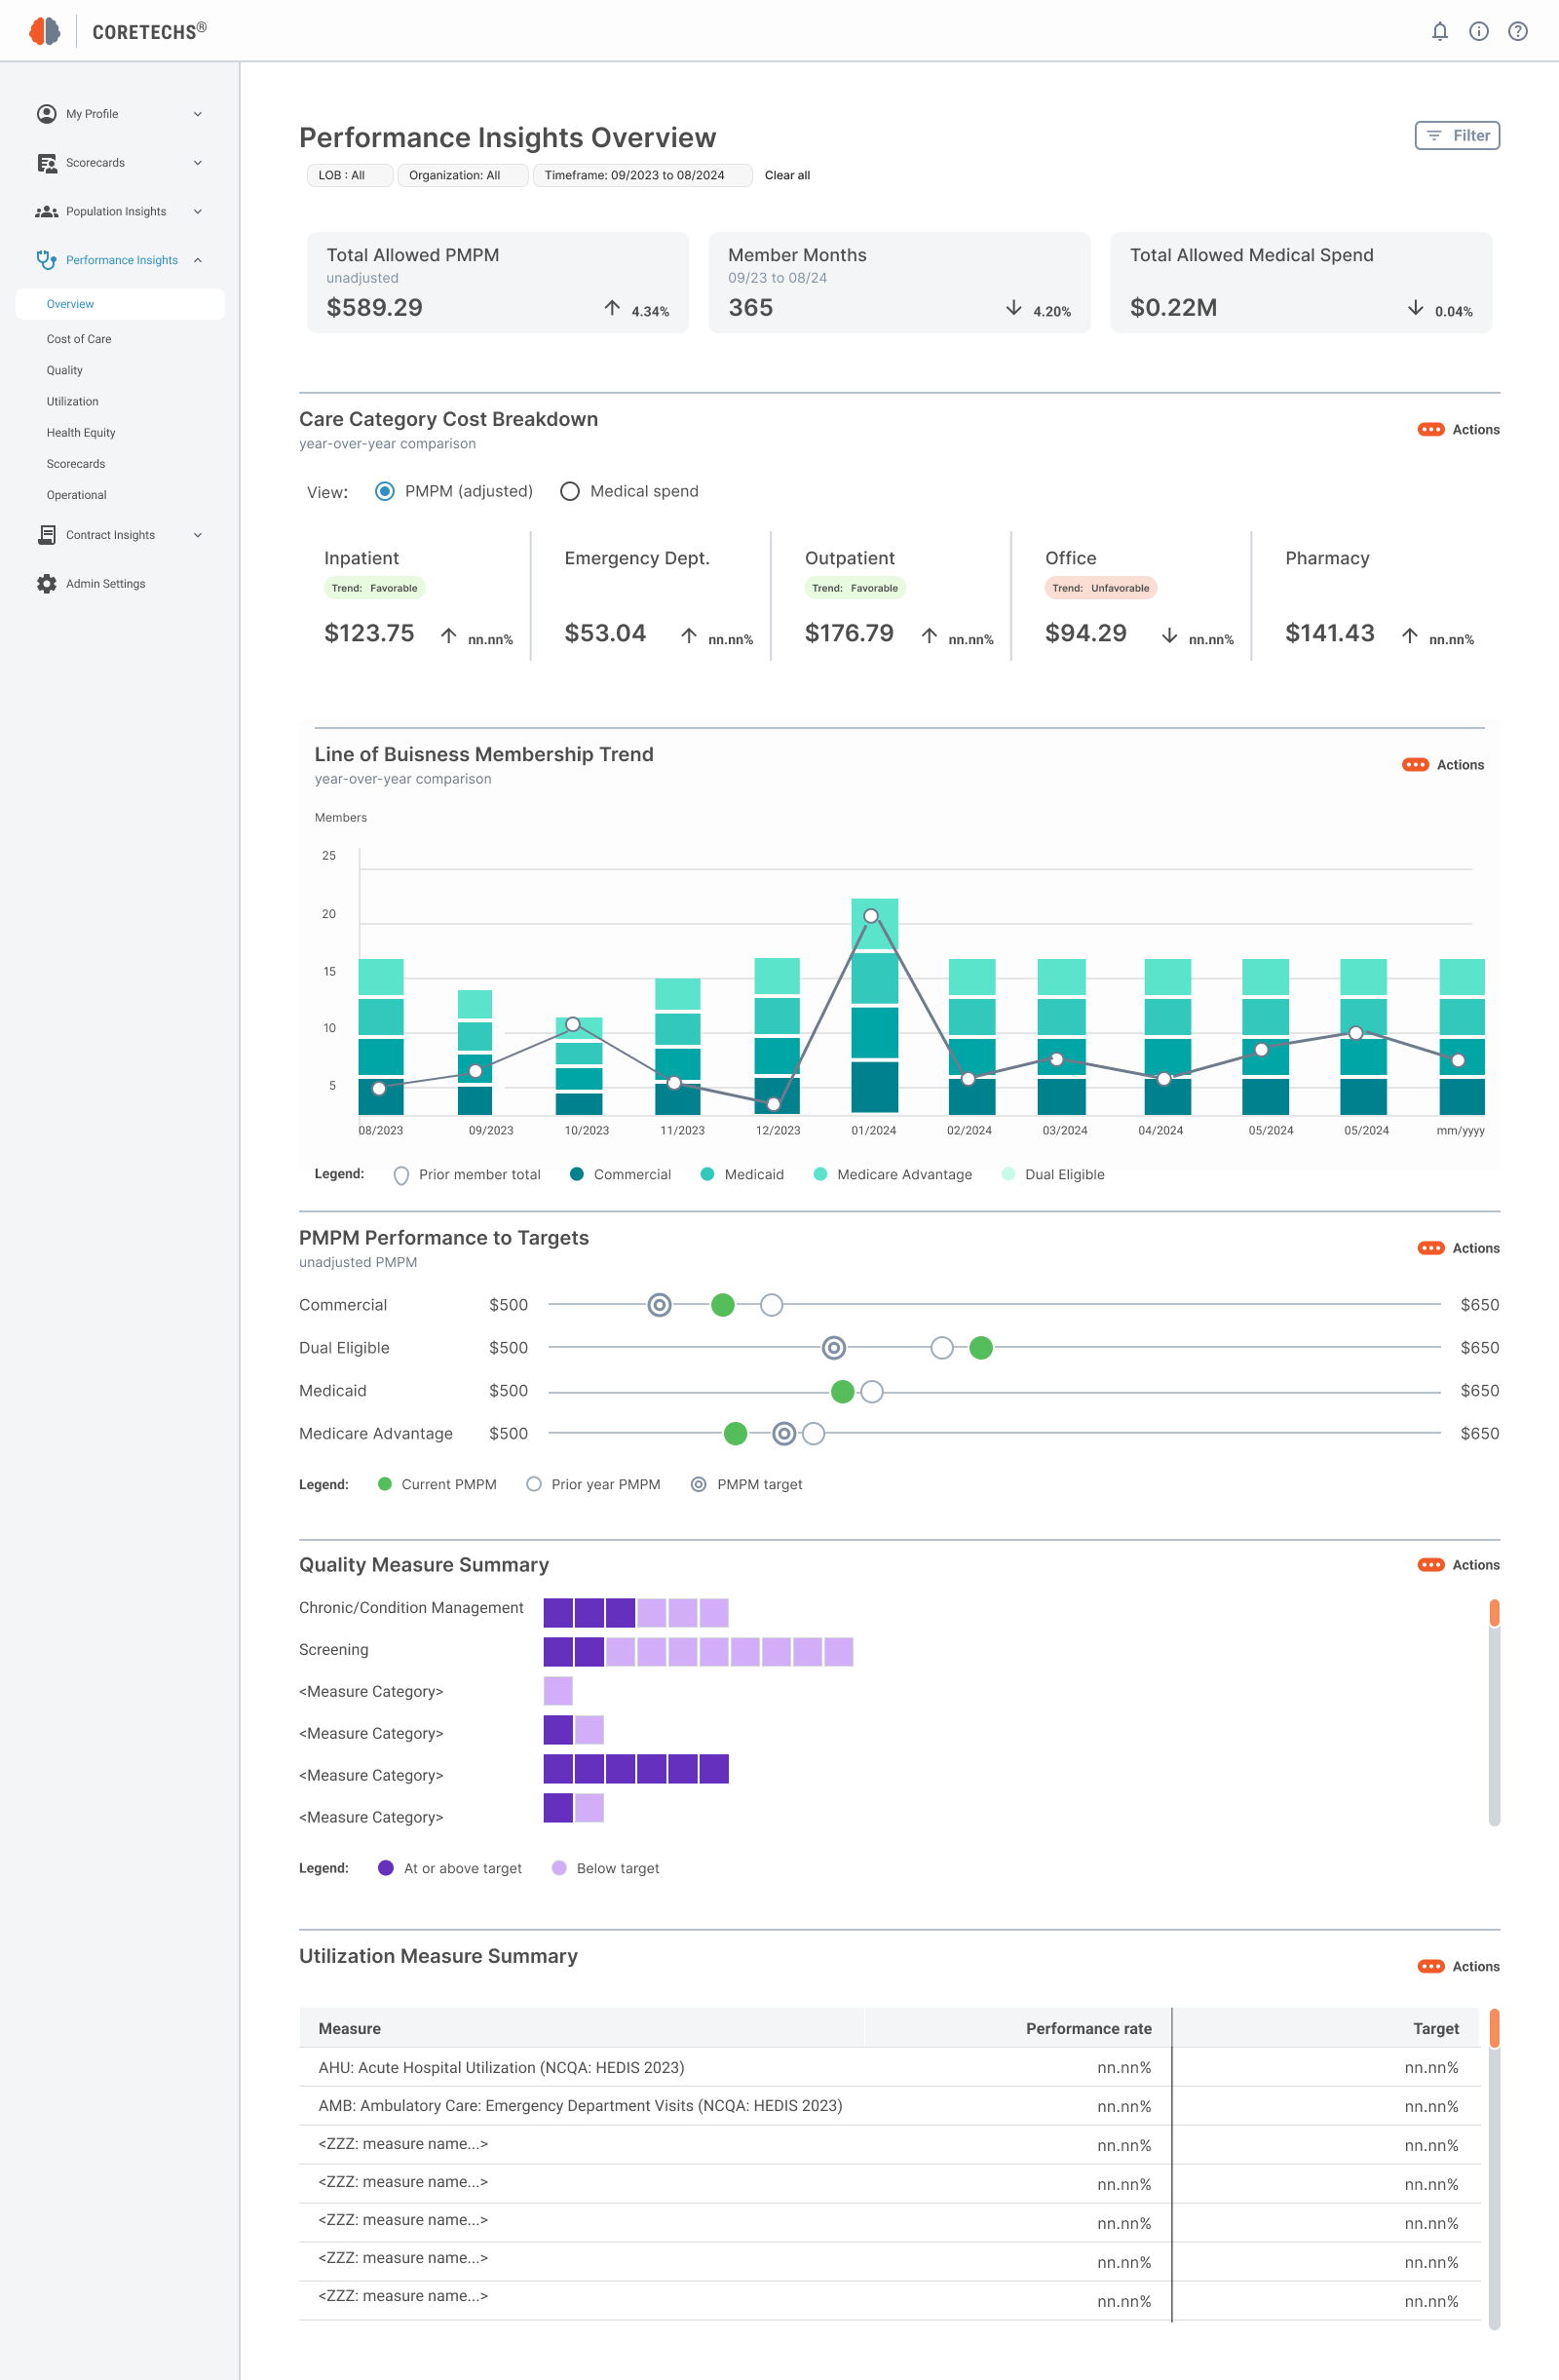
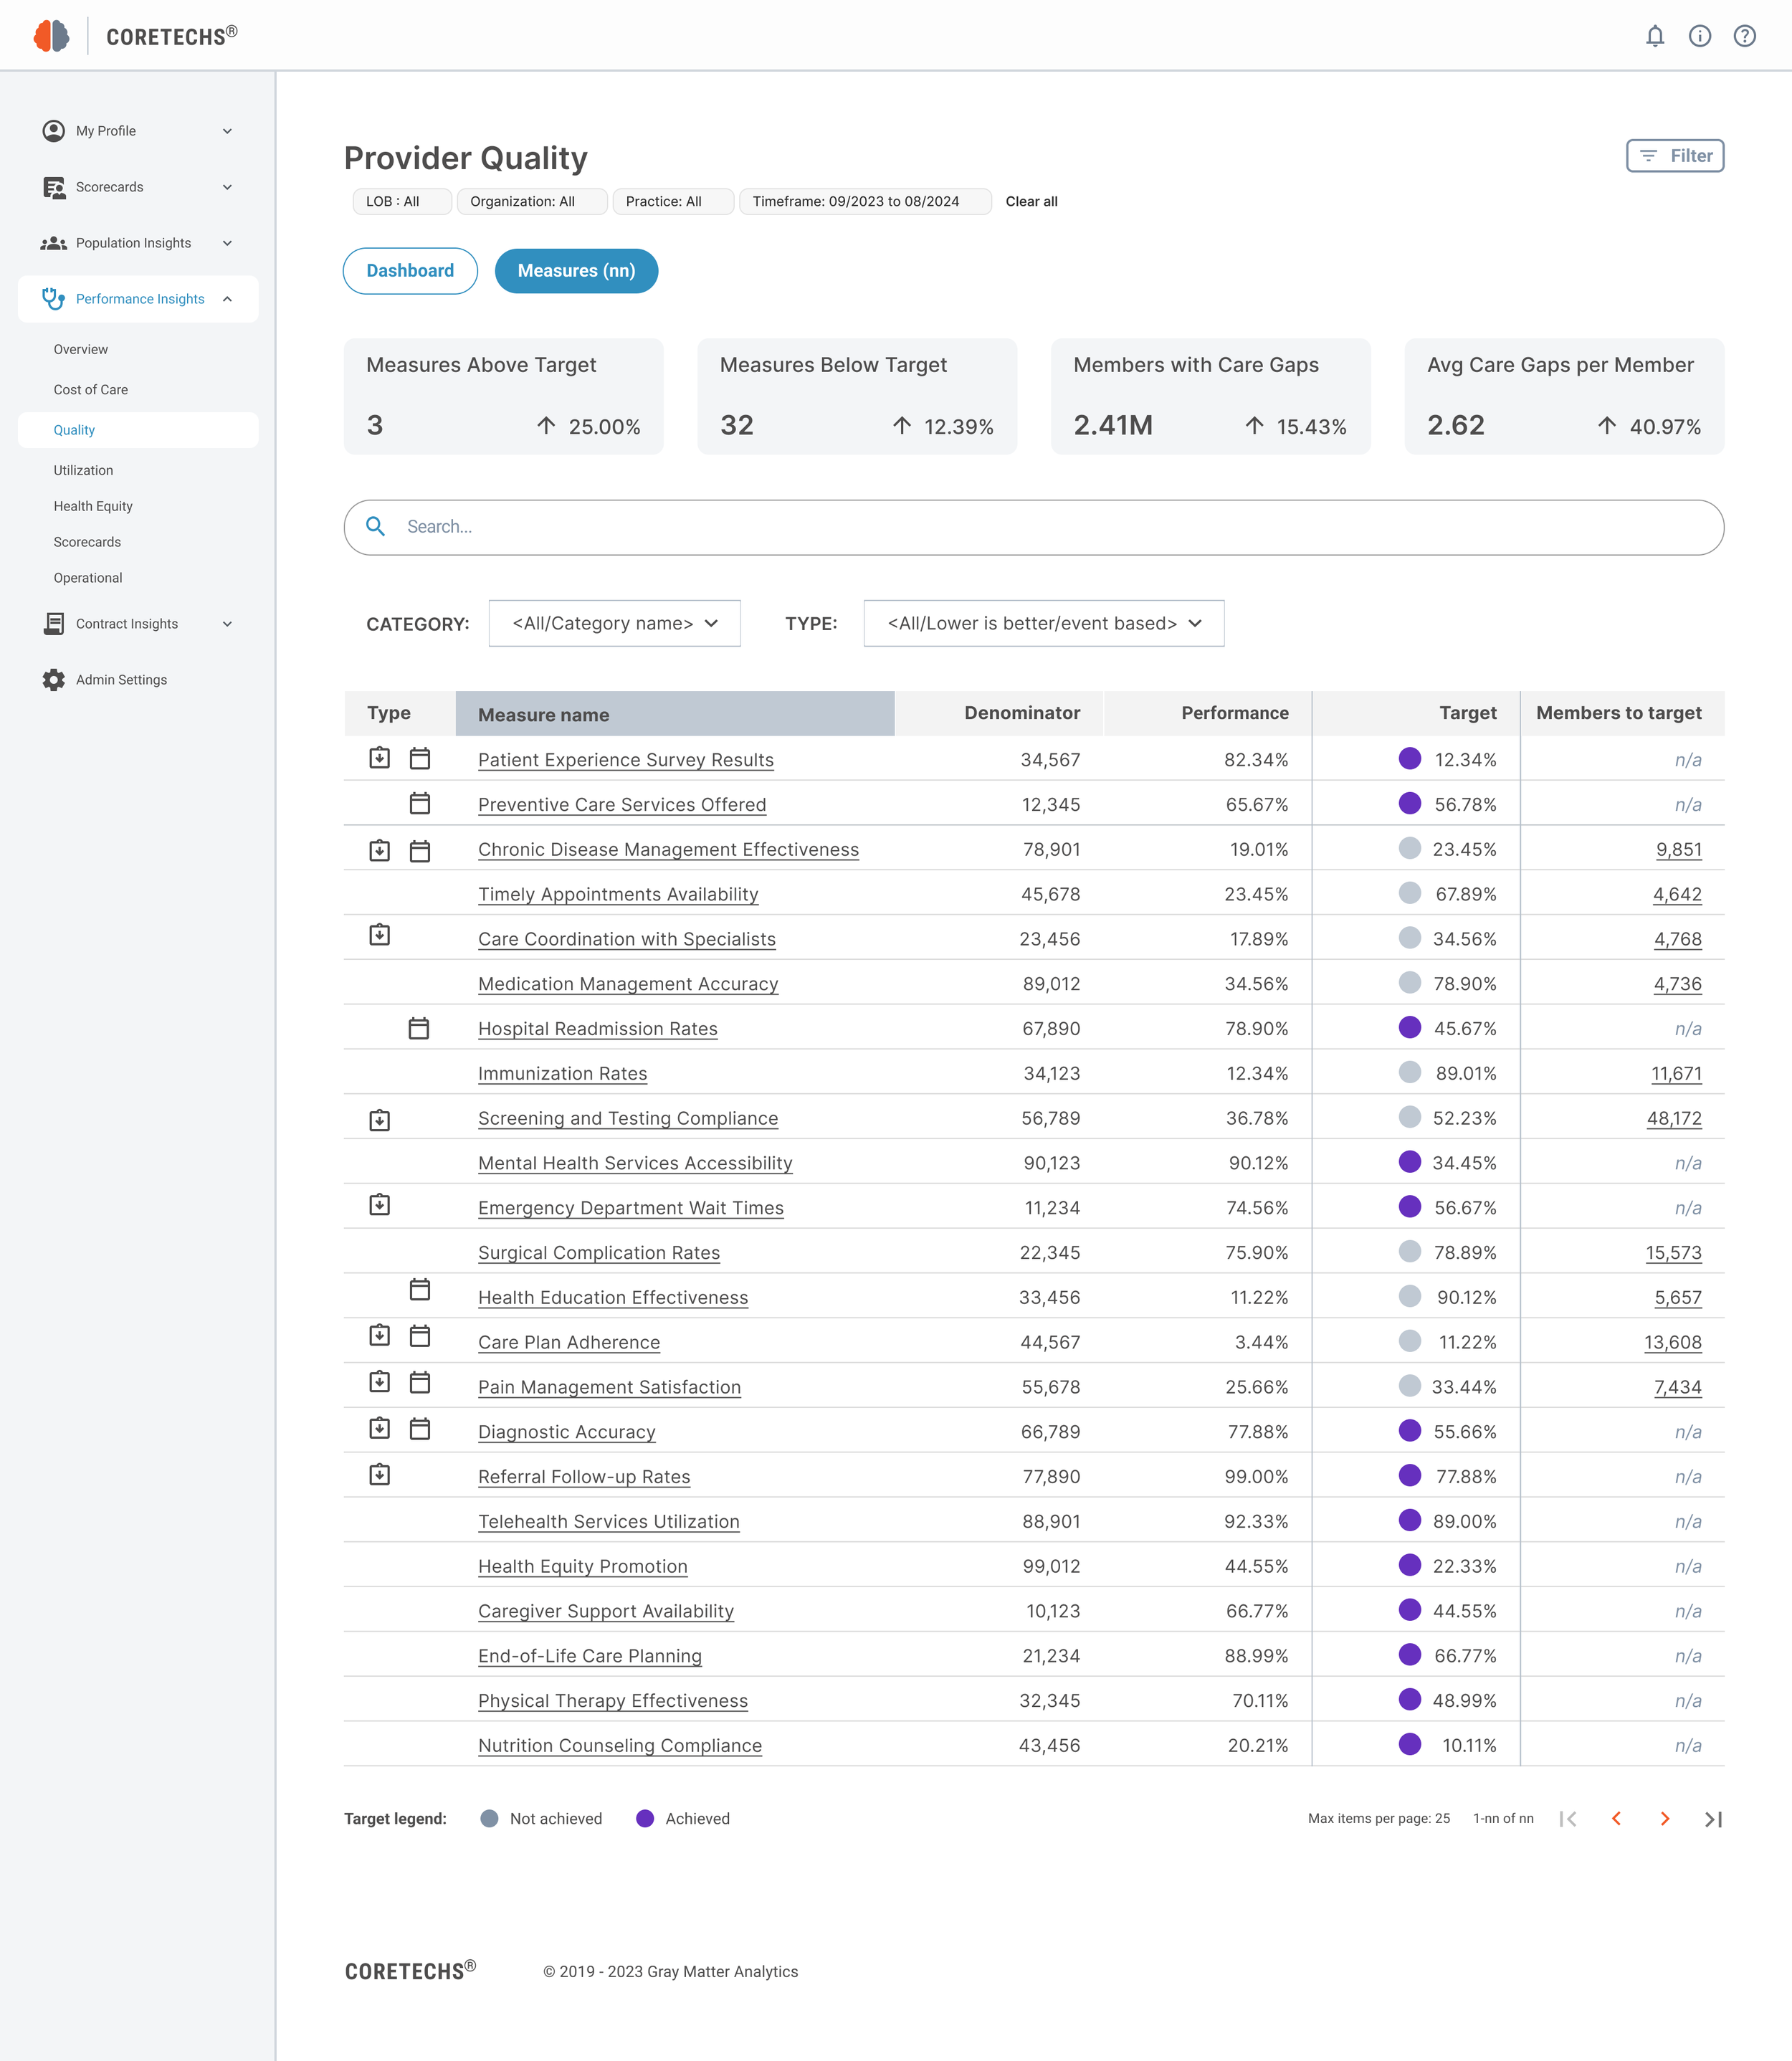
Users needed a way to quickly assess clinical performance metrics, such as patient outcomes and efficiency measures. The redesigned Performance Insights interface features:
KPI Dashboard:
Focused on key performance indicators (KPIs) for clinical managers to easily track trends in patient care and clinical workflows.
Comparative Analysis:
New tools for comparing current performance with historical data or industry benchmarks, simplifying decision-making.
Alerts & Notifications:
Customizable alerts that notify users of underperforming areas, enabling quicker intervention.
2. Simplify Contract Insights
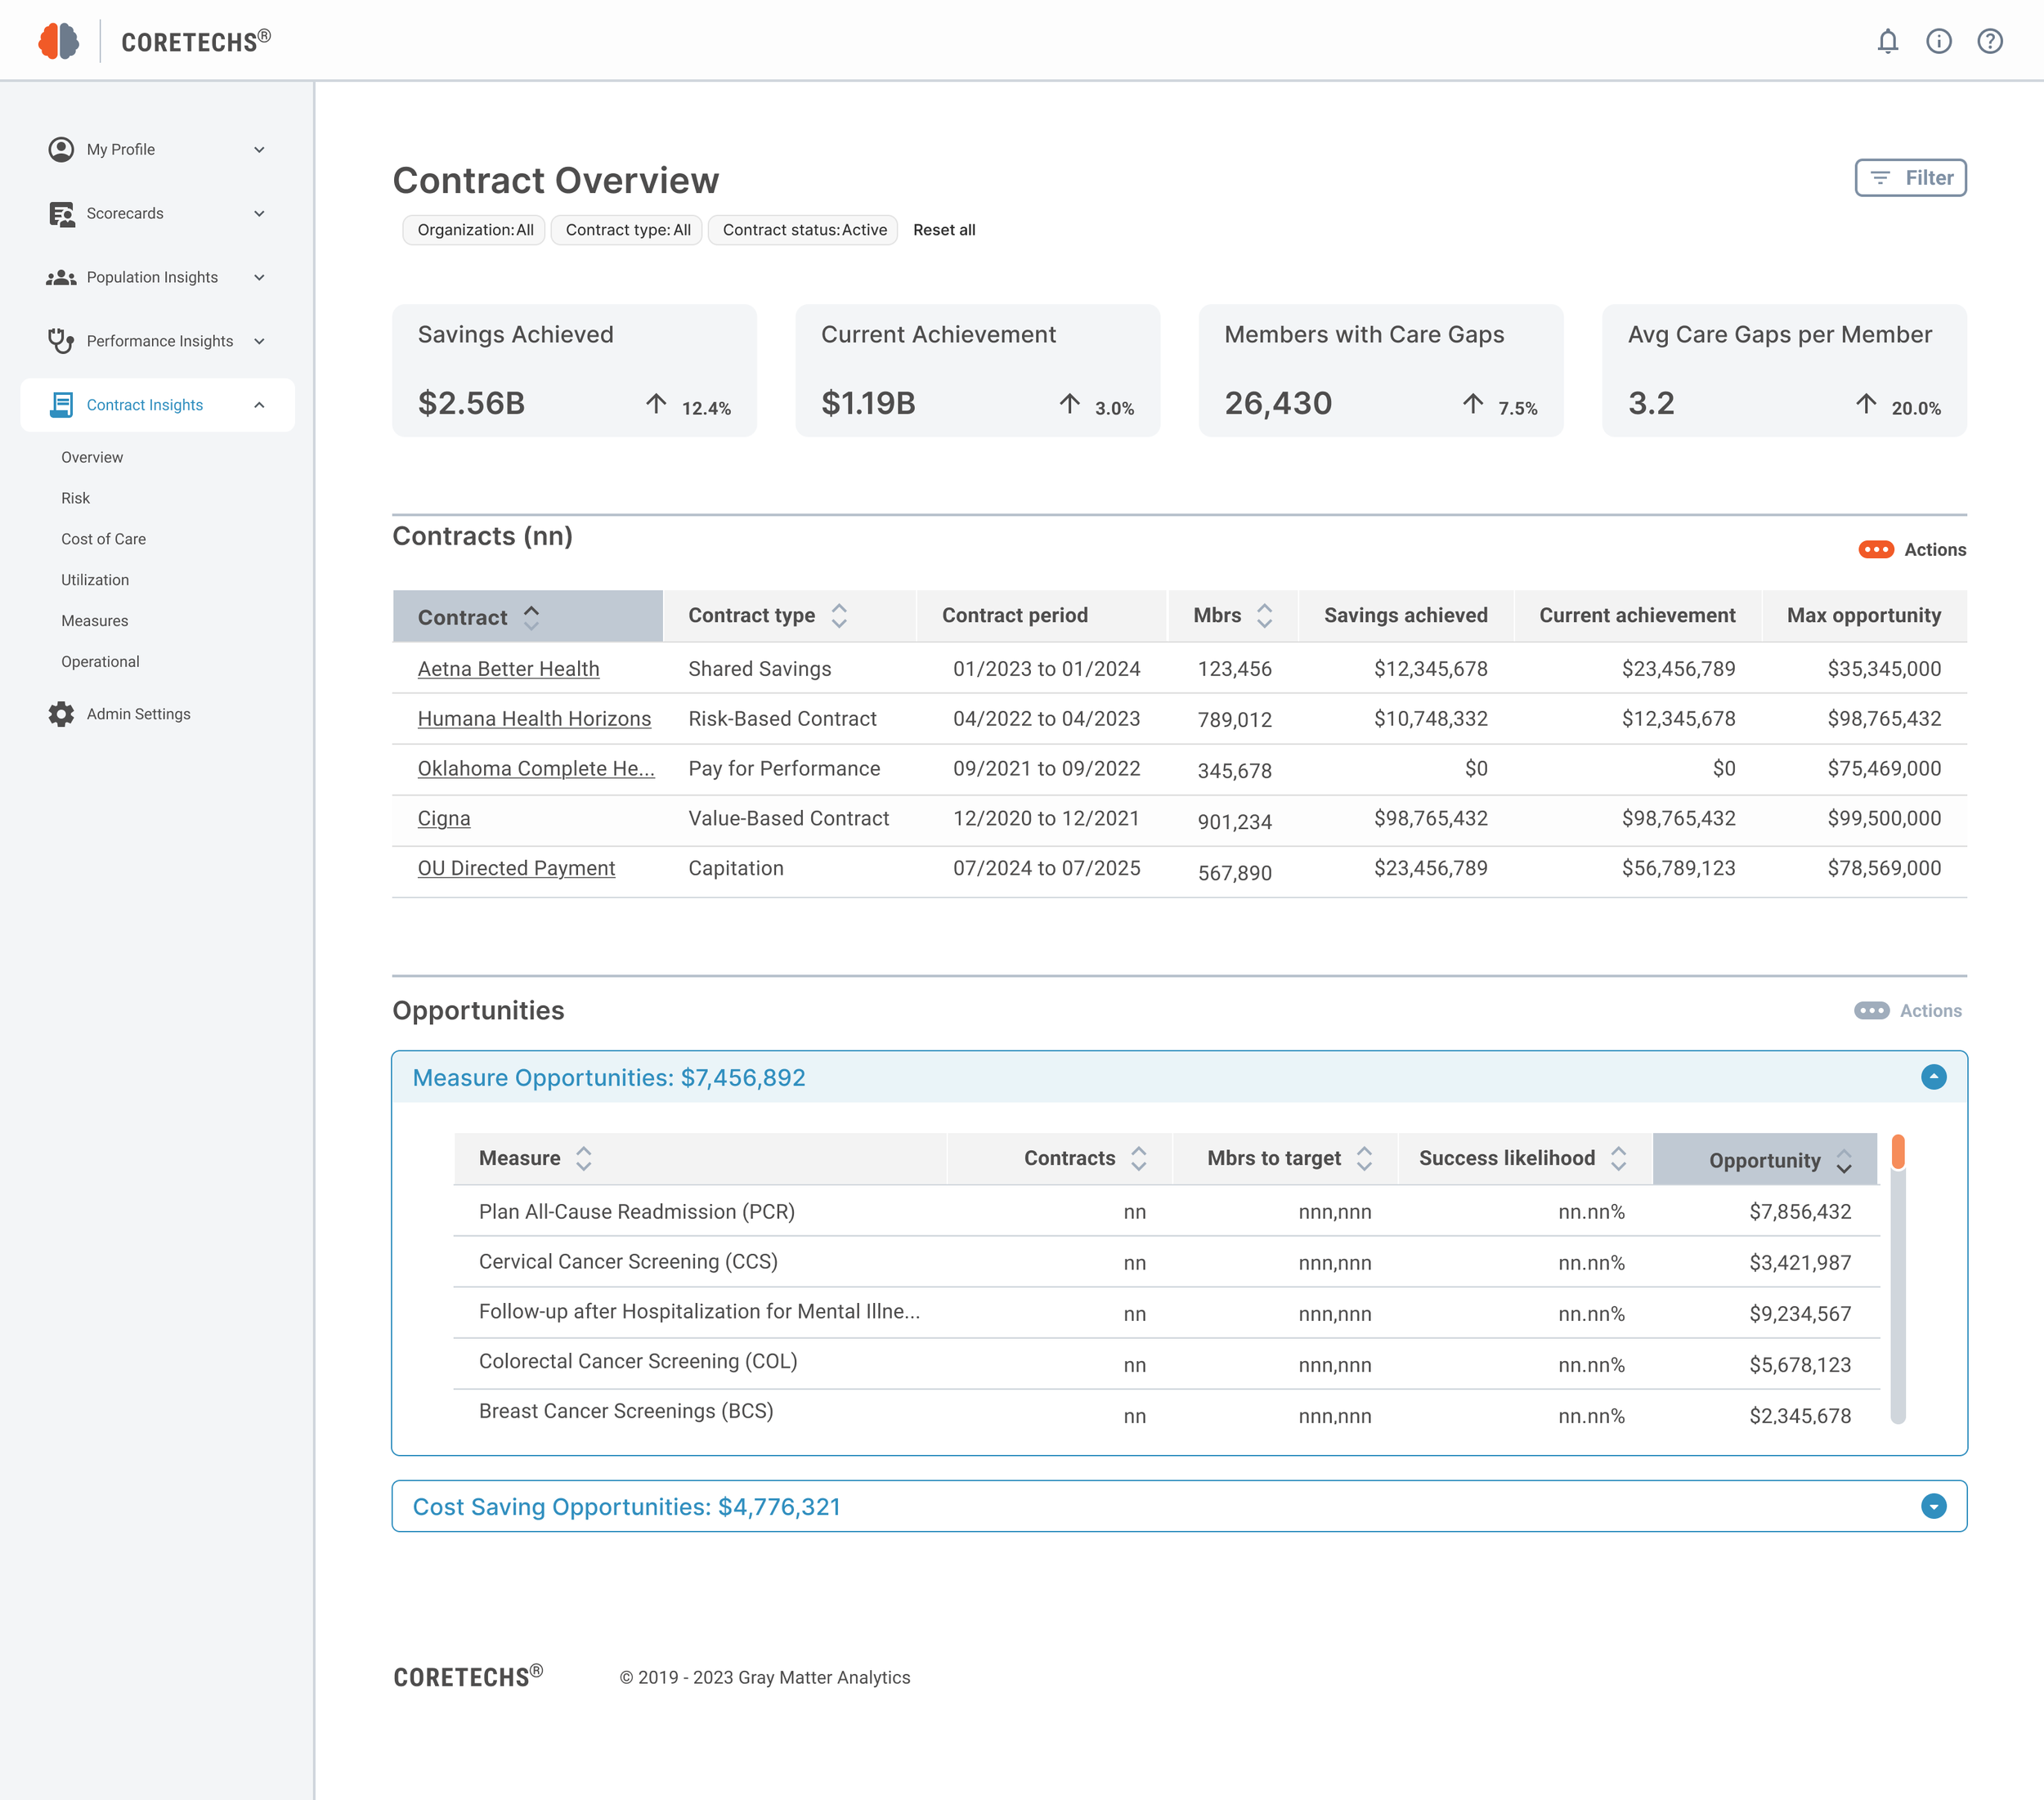
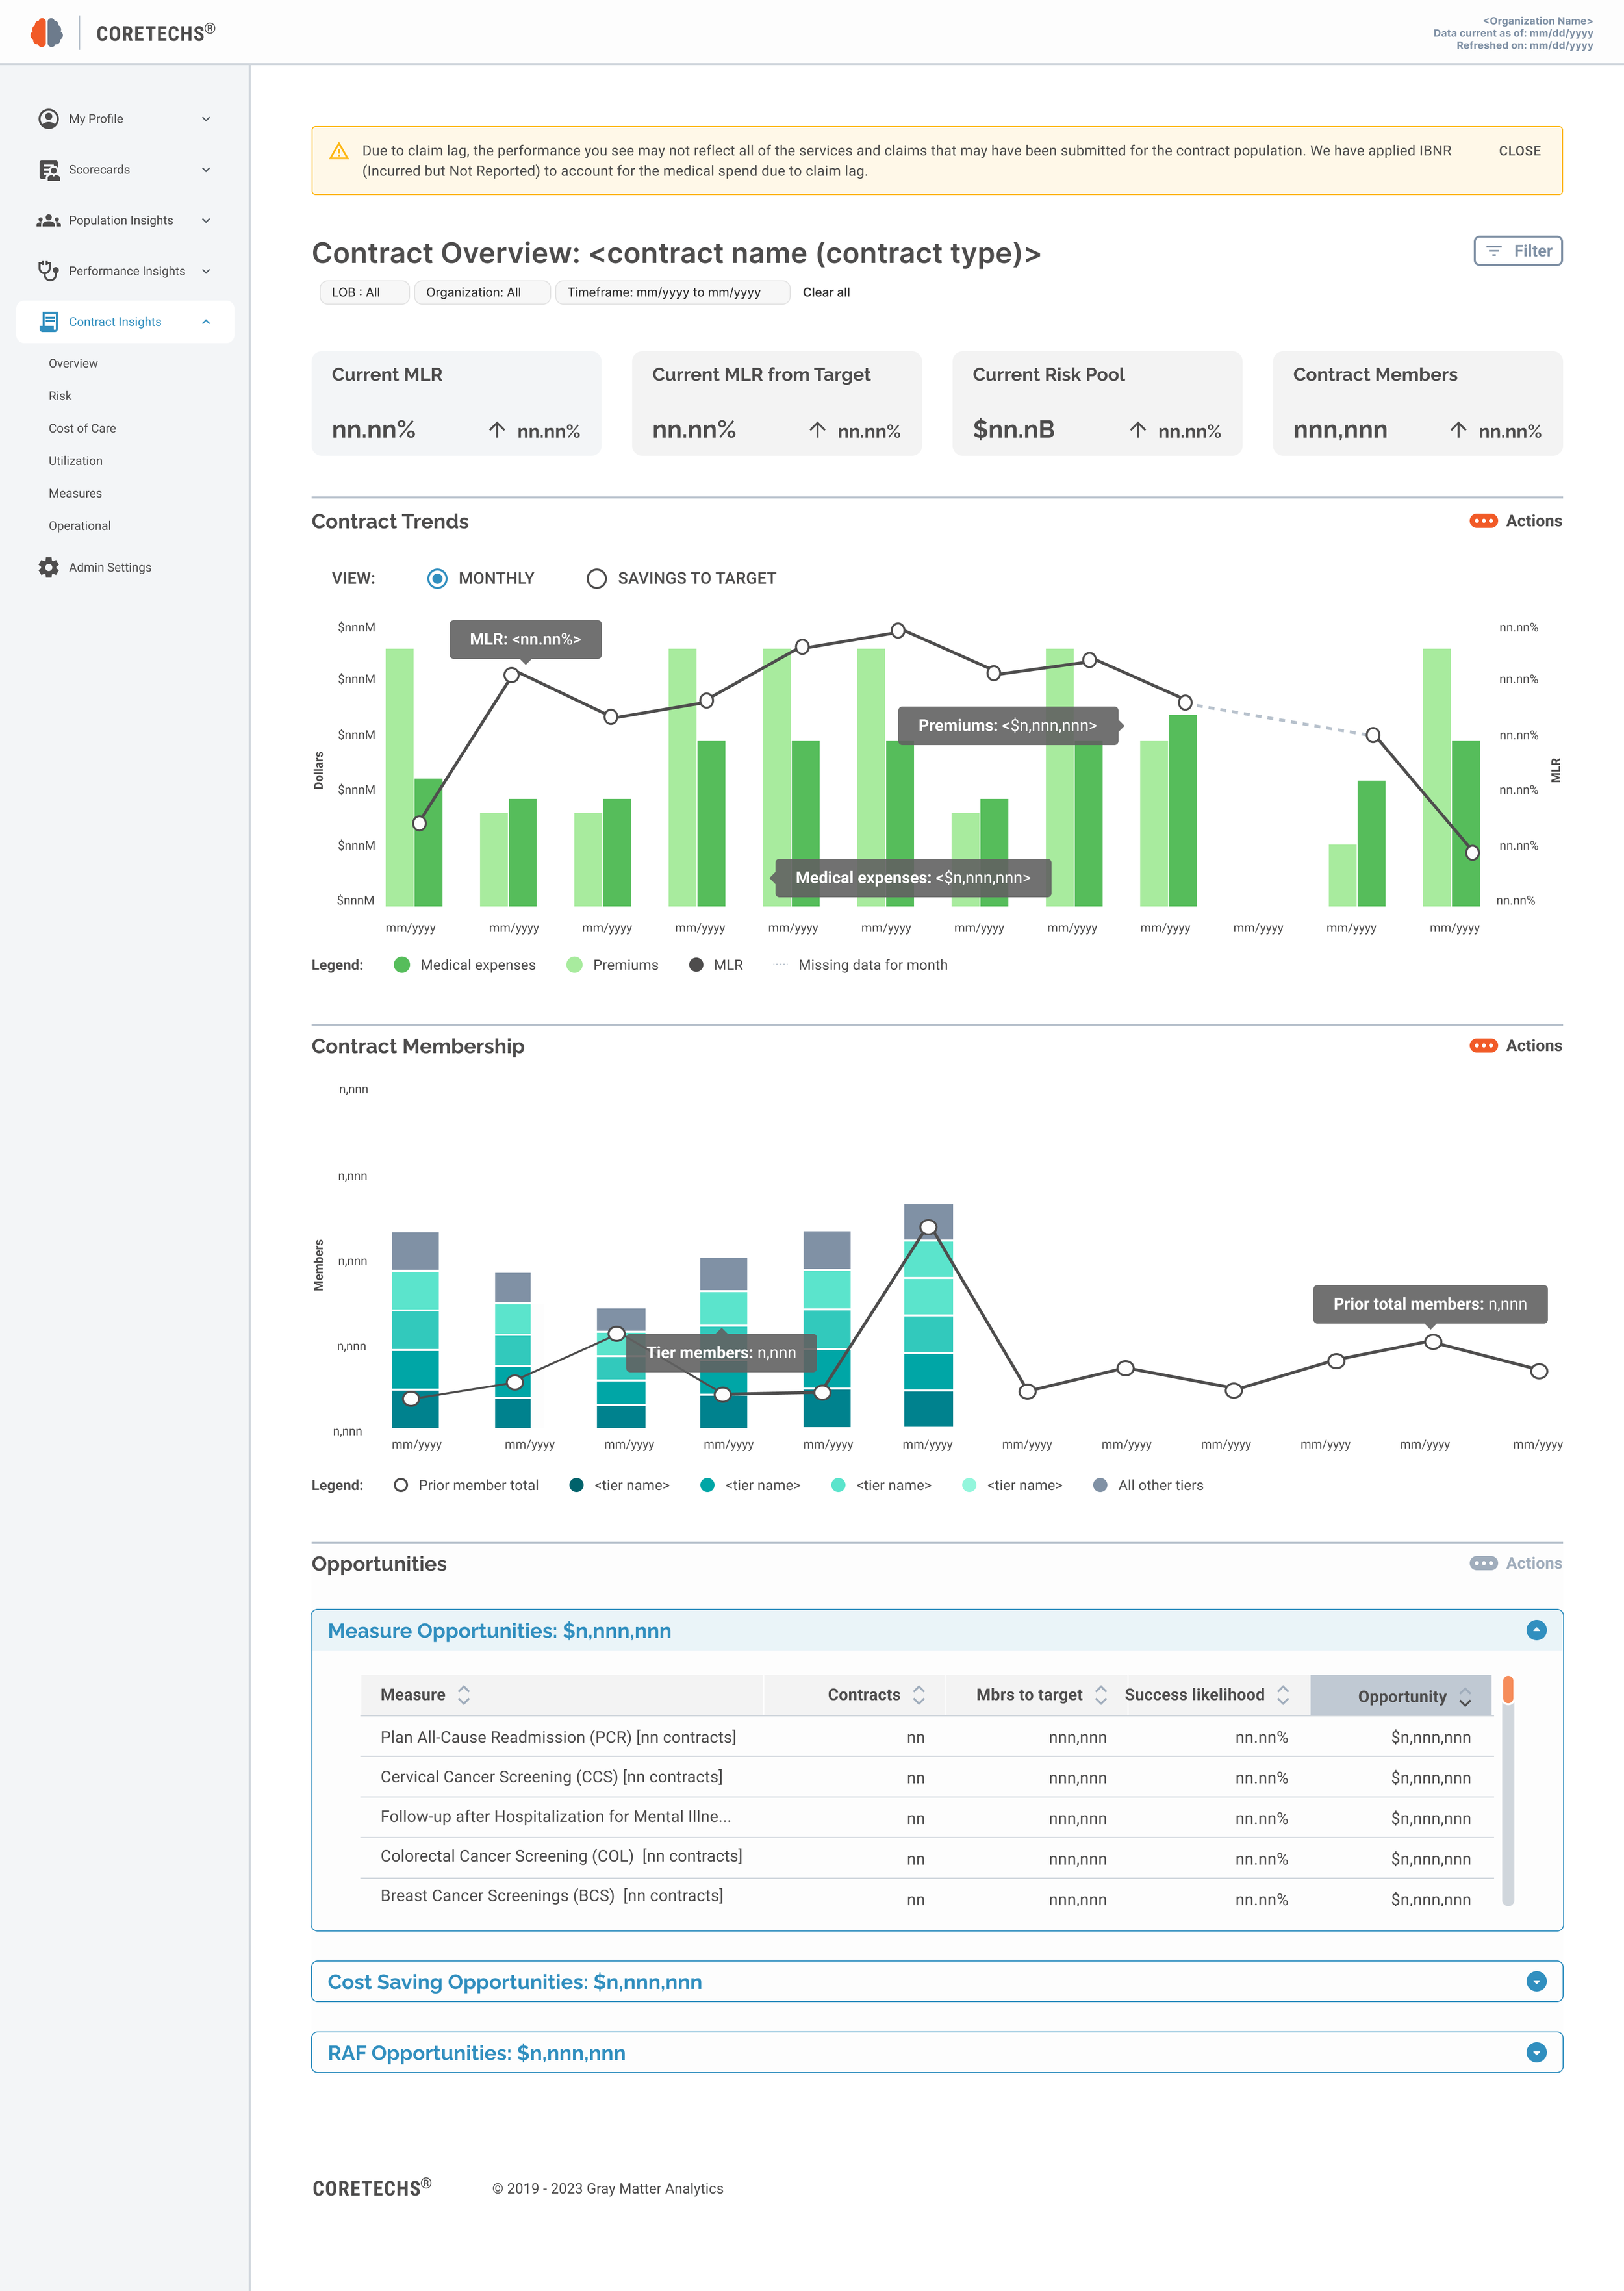
For contract administrators, optimizing payer contracts was a priority, especially in value-based care models. The Contract Insights redesign addressed this by:
Clear Contract Performance Overviews:
A streamlined dashboard highlighting contract compliance and performance metrics, with a specific focus on identifying opportunities for financial optimization.
Contract Comparison Tools:
Added a feature to compare multiple contracts side-by-side, helping users quickly identify discrepancies and optimize agreements.
Payer Trend Visualizations:
Data visualizations showing how contract performance trends over time, giving administrators a clear picture of their agreements.
3. Enhancing Population Insights
The Population Insights redesign aimed to make large sets of population health data more actionable for analysts by:
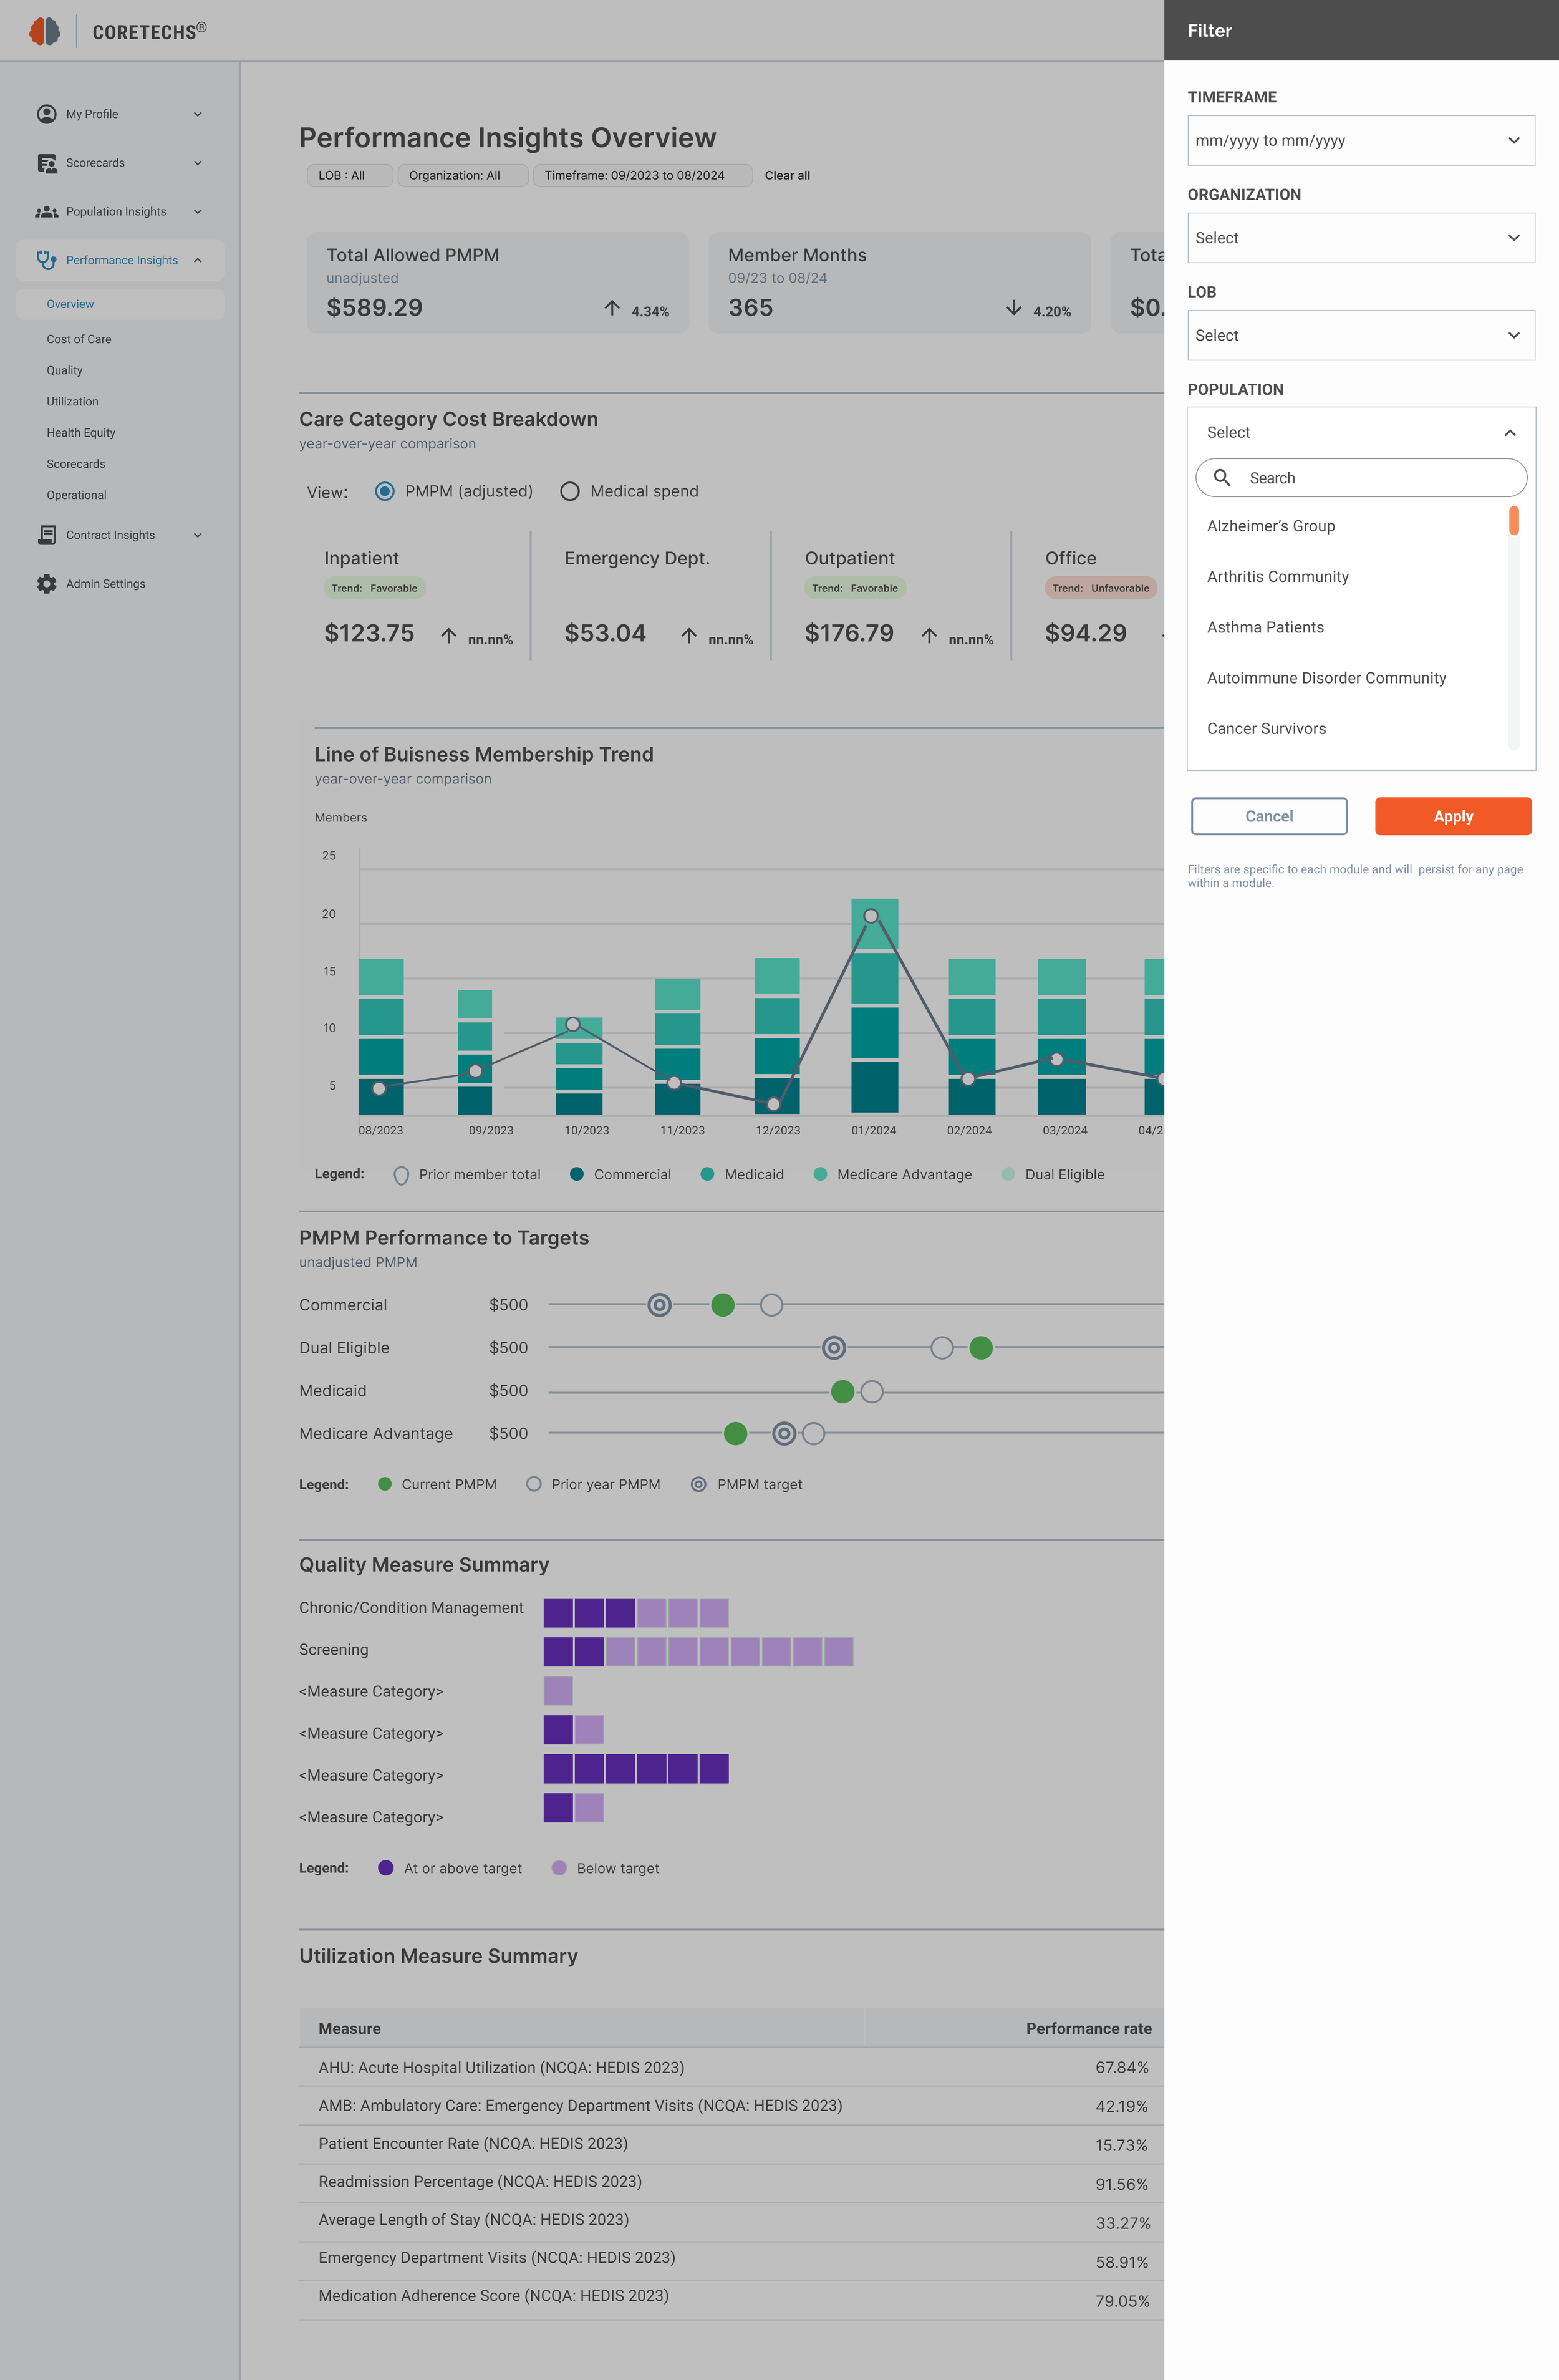
Advanced Filtering: Added advanced filtering options that allow users to drill down into specific population subgroups based on demographics, health outcomes, and social determinants.
Predictive Analytics: Integrated predictive analytics to help analysts forecast population health trends, enabling proactive interventions.
Heat Maps & Visual Overlays: Introduced visual tools like heat maps to easily identify high-risk populations and health disparities.
Prototyping & Testing
Wireframes
Created low-fidelity wireframes for each insights category, focusing on simplifying navigation and data accessibility. Feedback was gathered from users during usability testing, resulting in adjustments to the layout and feature prioritization.
High-Fidelity Designs
Following iterative testing, high-fidelity prototypes were developed for all three insights areas. The design focused on consistency across the platform, ensuring that users could seamlessly navigate between Performance, Contract, and Population Insights.
Key Features Added:
Customizable Dashboards: Users can personalize their insights dashboard based on their role and key metrics.
Simplified Filters: An intuitive filtering system allows users to quickly refine data and focus on what matters most.
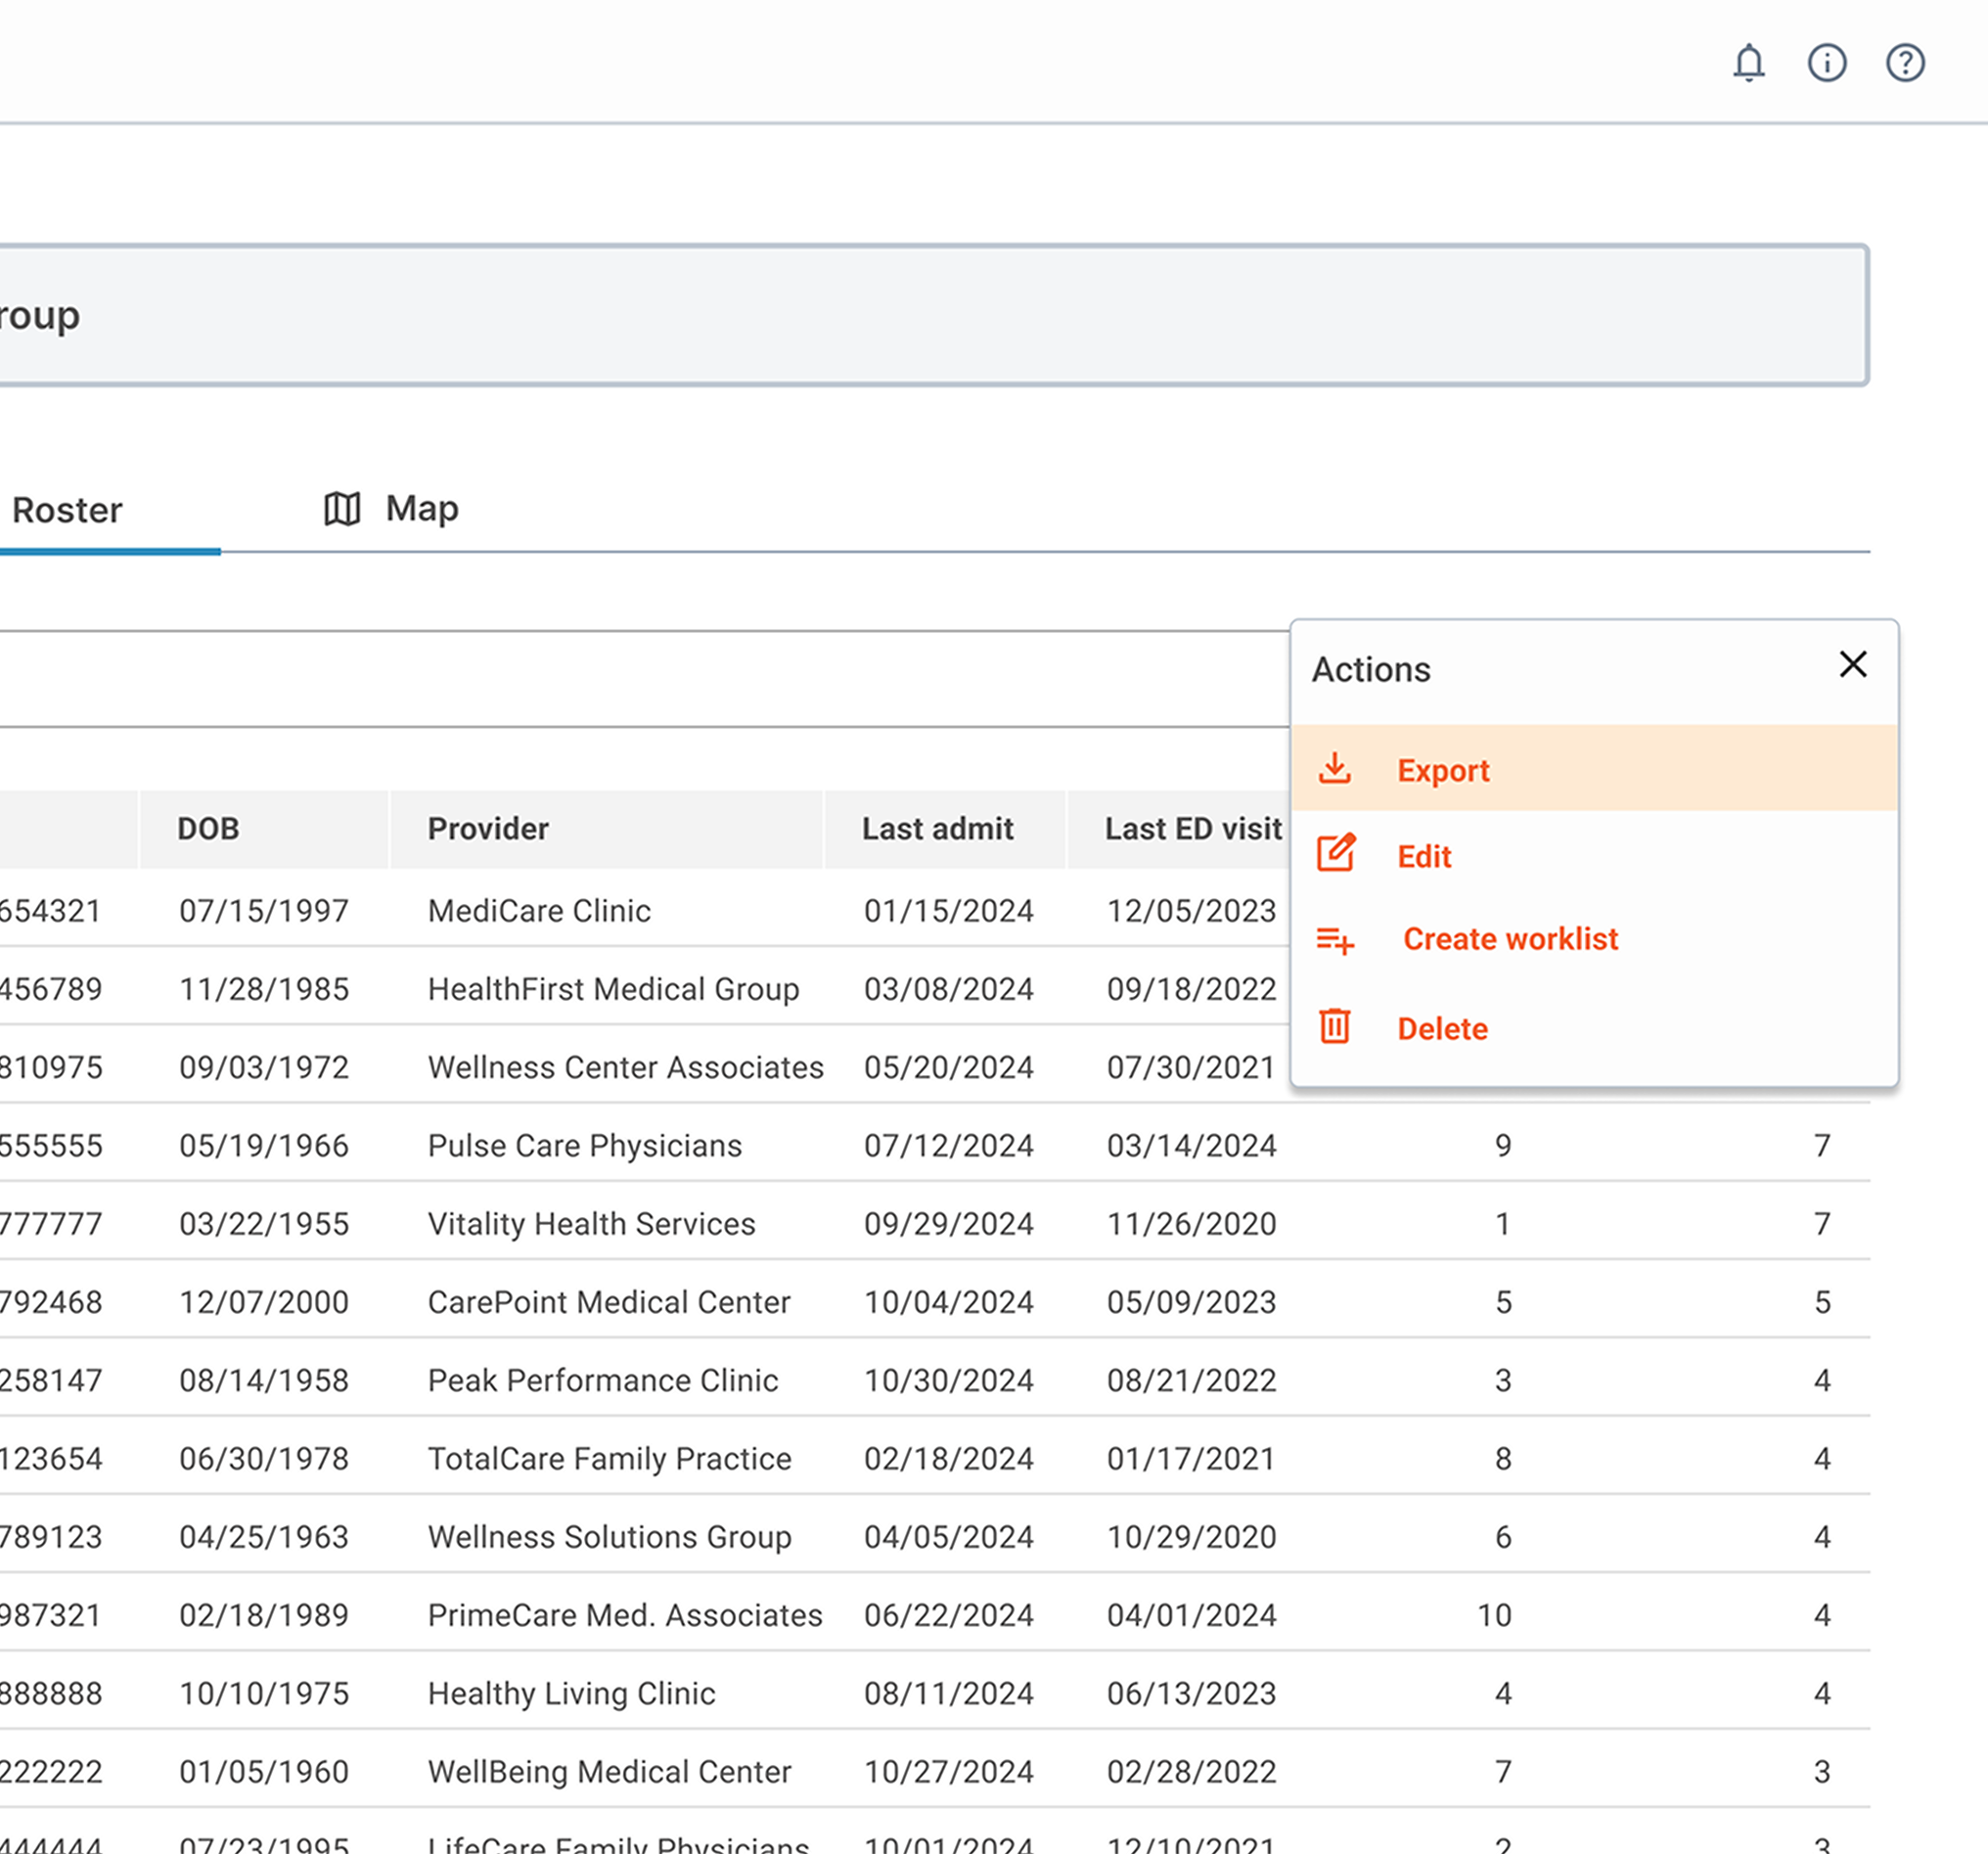
Data Export Functionality: Users can now export data from any insights view, making it easier to share reports with stakeholders.
Final Solution
The redesigned platform provided users with a more intuitive, streamlined experience across all three insights categories:
Performance Insights: Clinical managers can now track real-time performance metrics and identify trends with minimal effort.
Contract Insights: Administrators can easily evaluate payer contracts and optimize agreements, leading to better financial outcomes.
Population Insights: Population health analysts can filter and visualize health data more effectively, leading to actionable strategies for improving community health.
Impact and Results
Efficiency: Time spent navigating between Performance, Contract, and Population Insights decreased by 50%.
Adoption Rate: Engagement with the insights categories increased by 40%, as users found the platform more intuitive and actionable.
Satisfaction: Post-launch user satisfaction surveys showed a 45% increase in satisfaction scores, particularly around data accessibility and ease of use.
Reflection & Next Steps
What I Learned:
This project emphasized the importance of tailoring a platform to the distinct needs of its user personas. Each insights category (Performance, Contract, and Population) required careful attention to the specific workflows and pain points of users.
Next Steps
The next phase of this project will involve integrating AI-driven insights and predictive modeling across all three categories to further support proactive healthcare decision-making.
